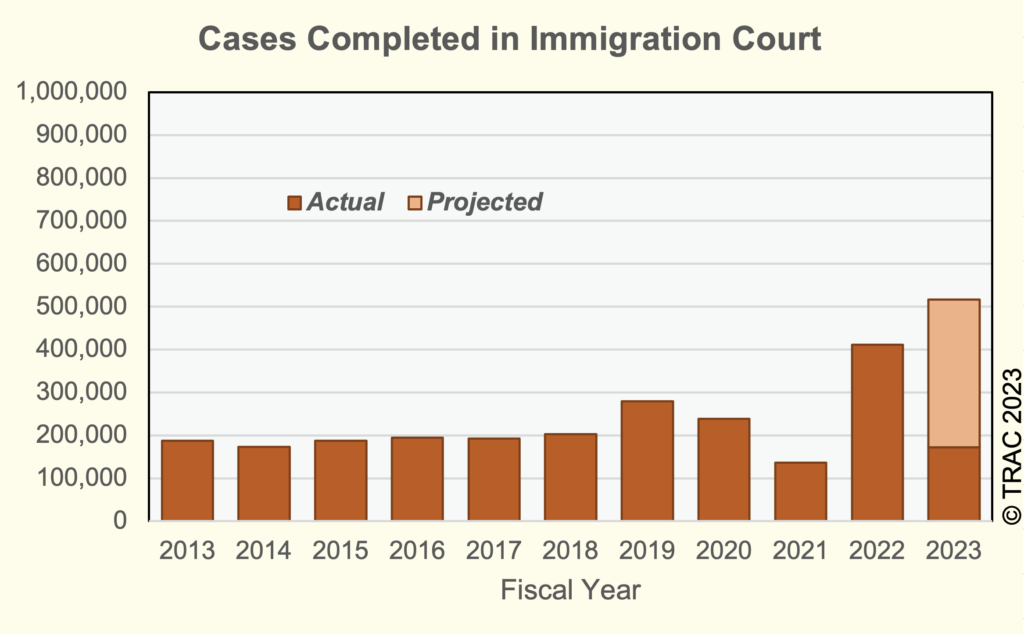
美国移民法庭的处置创下历史新高。在 2023 财年,美国法院关闭的移民案件数量将增加到近 50 万起,由移民法官处理。2022 财年的案件处理量比 2019 财年创下的历史高点高出 47%。在 2023 财年的前四个月(2022 年 10 月至 2023 年 1 月),法院关闭案件达到 172,180 起,比 2019 年同期高出 85% .
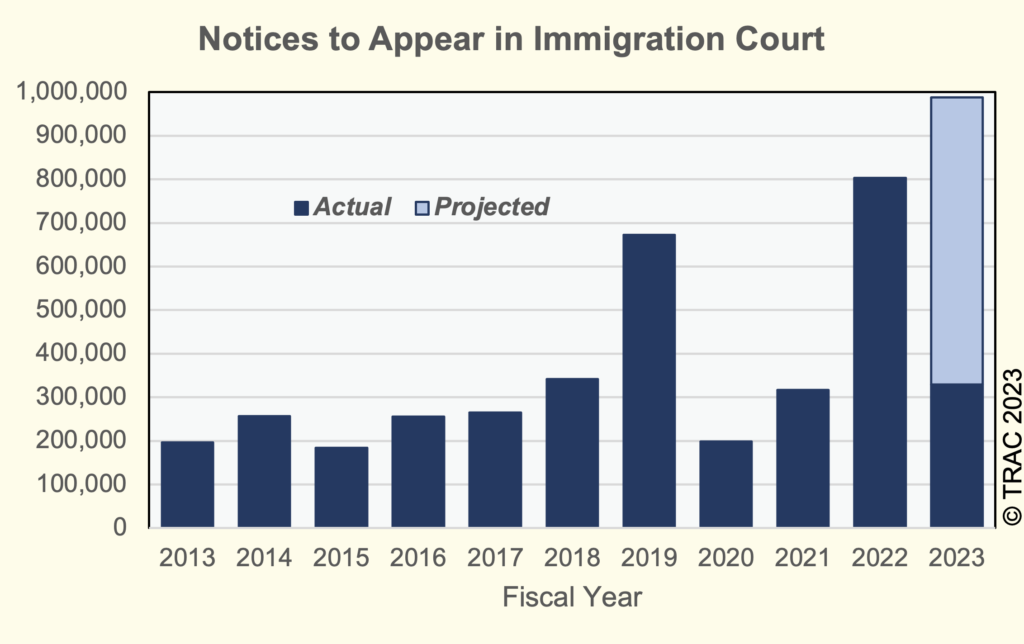
但是,如果国土安全部 (DHS) 向移民法庭提交新文件的速度继续下去,2023 财年的新案件数量也可能创下新纪录。在 2023 财年的同一四个月中,移民法庭的个案记录中记录了国土安全部发出的 329,380 份出庭通知 (NTA)。因此,法院今年有望收到近一百万份寻求驱逐移民的新 NTA。参见图 1 和 2。


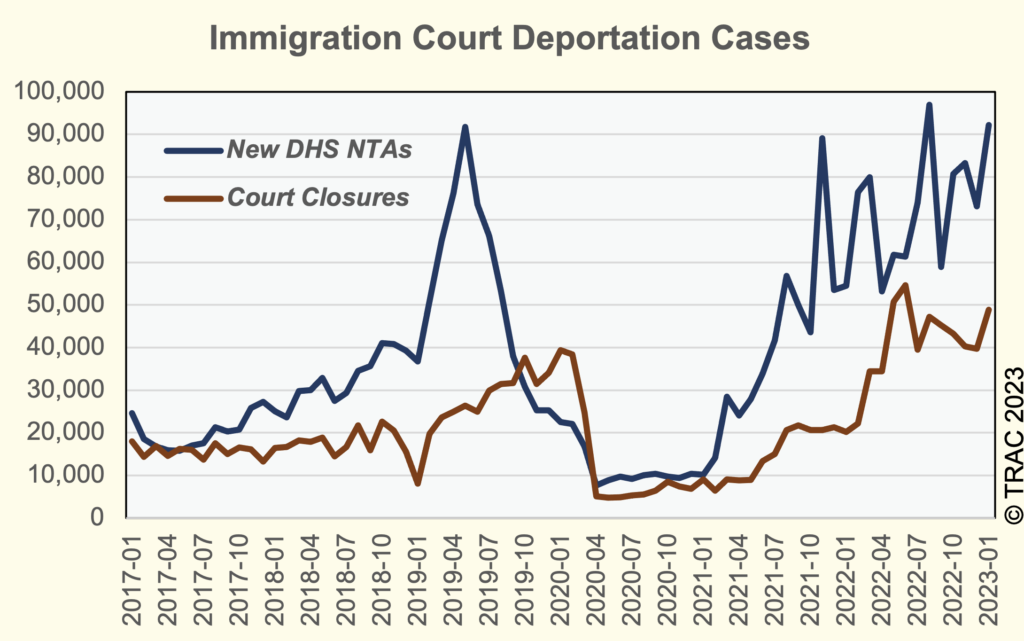
数据呈逐月递增趋势,到 2022 年 6 月,法院关闭数量迅速增加。在每月 40,000 到 50,000 之间反弹。2023 年 1 月,结案数量略低于 49,000。参见图 3。

如图 3 所示,即使结案数量的这种加速增长也不足以赶上新法院收到的新数量。新 NTA 数量在 2022 年 8 月达到峰值,略低于 100,000,然后上下波动,1 月份结束时约为 92,000 .
图 3 逐月显示了新的国土安全部 NTA 和法院案件处理之间的差异。图 3 中两条线之间的区域显示了每个月添加到法院积压中的案件。自 2017 年 1 月以来,只有几个月关闭的数量超过了新发布的 NTA。这发生在 2019 年 10 月到 2020 年 3 月。但是,实际上国土安全部在提交 NTA 方面长期以来一直落后,因此新案件实际上以较慢的速度到达法院的工作量,因此在此期间并没有下降得那么快并保持在结案之上。请参阅 TRAC 早期 关于延迟 NTA 申请的报告。
原文出自美国锡拉丘兹大学的数据分析团队,海华网用Google为海花们简单机翻。原文如下:
Immigration Court Case Closures Accelerate, Racing to Catch Up with Growing DHS Filings
Published Feb 21, 2023
Immigration Court dispositions are reaching record highs. In FY 2023, Court closures are on pace to grow to nearly half a million cases disposed of by Immigration Judges. Case dispositions in FY 2022 were a record 47 percent higher than the previous high set during FY 2019. During the first four months of FY 2023 (Oct 2022-Jan 2023), Court closures reached 172,180, 85 percent higher than a comparable period during 2019.
However, if the pace of new Department of Homeland Security (DHS) filings in Immigration Court continues, FY 2023 may also reach a new record for incoming cases. During the same four months of FY 2023, a total of 329,380 Notices to Appear (NTAs) issued by the DHS were recorded in Immigration Court case-by-case records. Thus, the Court is on pace this year to receive nearly a million new NTAs seeking to deport immigrants. See Figures 1 and 2.


Figures 1 and 2. Department of Homeland Security New Notices to Appear in Immigration Court Compared with Court Cases Completed, FY 2013 – FY 2023 (through January)
Zooming in to examine trends month-by-month, Court closures increased rapidly up through June 2022. Since then, Court closures have bounced around between 40,000 to 50,000 per month. In January 2023, case closures were just under 49,000. See Figure 3.
Even this accelerated growth in case closures has been insufficient to catch up with new Court receipts as also shown in Figure 3. New NTAs reaching the court peaked in August 2022 at just under 100,000, then fluctuated up and down, ending at around 92,000 in January.
The difference between new DHS NTAs and Court case dispositions is shown month-by-month in Figure 3. The area between the two lines in Figure 3 shows the cases added to the Court backlog during each month. There have been only a few months since January 2017 when closures exceeded new NTAs issued. This occurred from October 2019 to March 2020. However, in reality DHS had long fallen behind in filing NTAs, so new cases actually reach the Court’s workload in a slower stream so didn’t fall so rapidly and kept above closures during this period. See TRAC earlier report on delayed NTA filings.

Figure 3. New Department of Homeland Security Issued Notices to Appear (NTAs) in Immigration Court vs. Court Closures, January 2017 – January 2023
Immigration Court Backlog Is Now 2.1 Million
Closures would need to be double current levels simply to keep up with new filings. The likelihood of doubling the judges and staffing of the Immigration Court any time soon to achieve such a goal seems remote. As of the end of last year, the Executive Office for Immigration (EOIR) reports there were 634 Immigration Judges. A record number of 104 judges were hired during FY 2022, and according to EOIR press releases, 66 have been added so far during the FY 2023. See Table 1. However, despite this record hiring, new hires are only a fraction of the number that are actually needed to keep up with new filings and start reducing the existing Court backlog.
Table 1. Growth in the Number of Immigration Judges, FY 2010 – 2023 (as of February)
| Fiscal Year | Number of Immigration Judges | ||
|---|---|---|---|
| New Hires | Left Position | On Board | |
| 2010 | 17 | na | 245 |
| 2011 | 39 | 11 | 273 |
| 2012 | 4 | 10 | 267 |
| 2013 | 8 | 13 | 262 |
| 2014 | 0 | 13 | 249 |
| 2015 | 20 | 15 | 254 |
| 2016 | 56 | 21 | 289 |
| 2017 | 64 | 15 | 338 |
| 2018 | 81 | 24 | 395 |
| 2019 | 92 | 45 | 442 |
| 2020 | 99 | 24 | 517 |
| 2021 | 65 | 23 | 559 |
| 2022 | 104 | 29 | 634 |
| 2023* | 66 | na | na |
* As of February 2023; na stands for not available.
At the beginning of the Trump administration the backlog was 542,411. Two years ago, at the end of the Trump administration and the beginning of the Biden administration it was 1.3 million, up 139 percent. Today, two years later at the end of the first two years of the Biden administration, the Immigration Court’s backlog has reached 2,097,195, already up 62 percent since Biden took office.
